Product details
FollowLine_v1.0 Product Overview
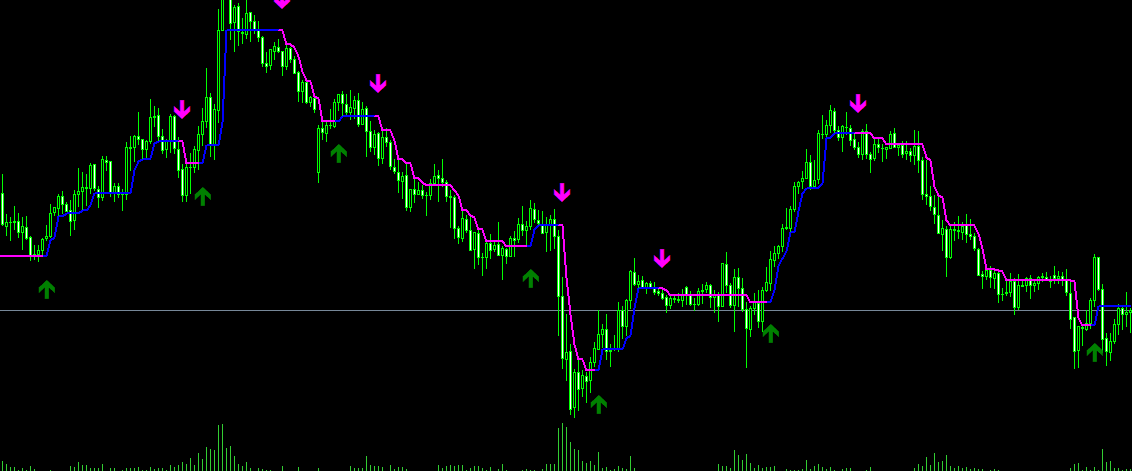
FollowLine is a professional trend-following indicator that combines Bollinger Bands and Moving Averages
to identify market trend direction and deliver clear buy/sell signals when trends reverse.
- [Key Features]
- - Dynamic trend line tracks price movement
- - Automatically identifies trend reversal points
- - Provides clear buy and sell arrow signals
- - Supports multiple arrow display modes
- - Optional ATR filter to reduce false signals
- - Pop-up and sound alert notifications
- ========================================
- [Indicator Principle]
- ========================================
The indicator uses Bollinger Bands to determine trend direction:
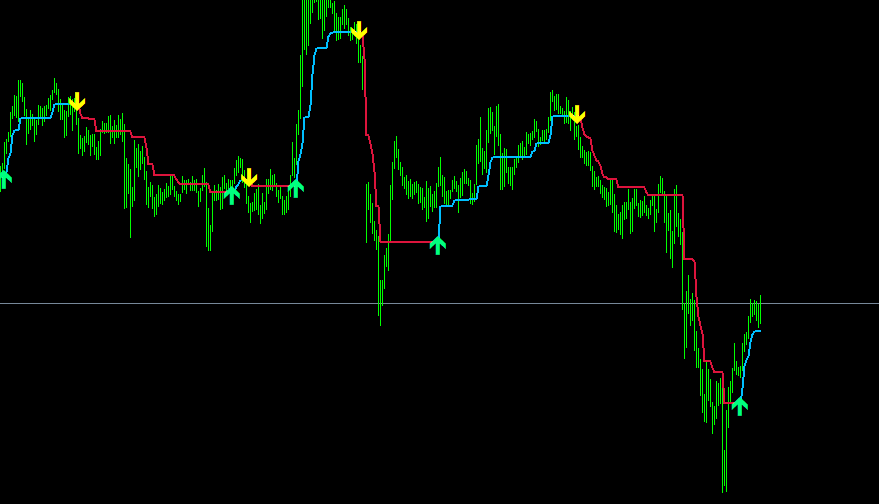
- 1. When price breaks above the upper Bollinger Band → Uptrend confirmed
- - Trend line tracks the low price (optionally plus ATR distance)
- - Displays a blue uptrend line
- 2. When price breaks below the lower Bollinger Band → Downtrend confirmed
- - Trend line tracks the high price (optionally minus ATR distance)
- - Displays a red downtrend line
- 3. Arrow signals appear during trend reversals
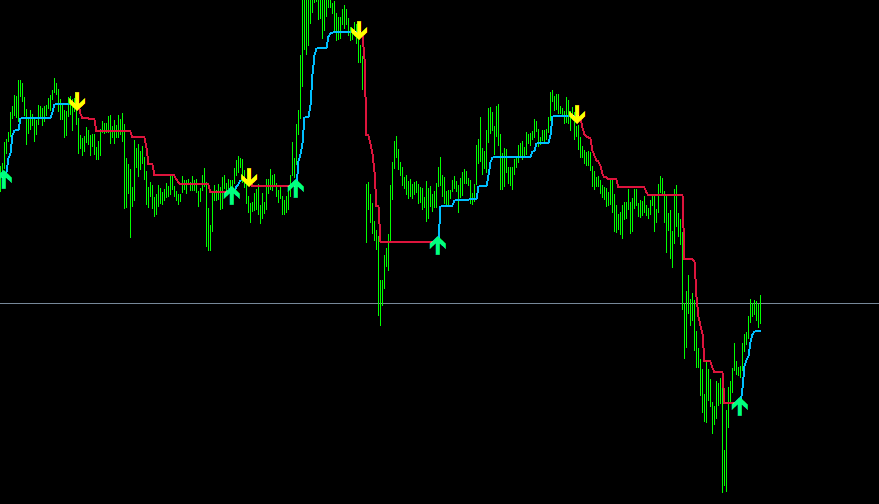
- - Green upward arrow = Buy signal
- - Yellow downward arrow = Sell signal
- ========================================
- [Parameter Settings]
- ========================================
- [Basic Parameters]
- BarsCount = 10000
- - Number of bars to calculate
- - Default of 10,000 bars is sufficient for most scenarios
- - Larger values increase computational load
- BBperiod = 21
- - Bollinger Bands period
- - Default is 21 periods
- - Smaller values (e.g., 10) are more sensitive but generate more false signals
- - Larger values (e.g., 50) are more stable with slightly lagging signals
- BBdeviations = 1
- - Bollinger Bands standard deviation multiplier
- - Default multiplier is 1
- - Smaller values produce more frequent signals
- - Larger values produce fewer but higher-quality signals
- MAperiod = 21
- - Moving Average period
- - Used for arrow filtering (when TypeOfArrows > 1)
- - Controls the conditions for displaying arrows
- ATRperiod = 5
- - ATR (Average True Range) period
- - Used to calculate the distance between the trend line and price
- - Smaller values provide tighter trailing
- - Larger values allow more room for price movement
- [Function Switches]
- UseATRfilter = TRUE
- - Enable/disable ATR filter
- - TRUE: Trend line maintains an ATR offset from price
- - FALSE: Trend line directly tracks high/low prices
- - Recommended to keep enabled to reduce false triggers
- AlertON = TRUE
- - Enable/disable alerts
- - TRUE: Pop-up alert on trend reversal
- - FALSE: Turn off alerts
- TypeOfArrows = Simple_Arrows
- - Arrow display mode
- - Hide_Arrows: Do not display arrows
- - Simple_Arrows: Simple mode, displayed on trend reversal
- - Open_Cose_Median: Filtered by Open/Close/Median price
- - High_Low_Open_Close: Filtered by High/Low/Open/Close price
- ========================================
- [How to Use]
- ========================================
[Basic Usage]
- 1. Trend Identification
- - Blue line = Uptrend (focus on long positions)
- - Red line = Downtrend (focus on short positions)
- - Price above trend line = Strong trend
- - Price touching trend line = Potential entry point
- 2. Entry Signals
- - Green upward arrow = Buy signal
- - Yellow downward arrow = Sell signal
- - Wait for a pullback after the arrow appears before entering
- 3. Stop Loss Setup
- - Long trades: Place SL below the trend line
- - Short trades: Place SL above the trend line
- - The trend line adjusts dynamically and can be used for trailing stop loss
[Advanced Usage]
- 1. Combining with Price Action
- - Wait for a price pullback after an arrow appears
- - Look for support/resistance near the trend line
- - Observe candlestick patterns to confirm signals
- 2. Multi-Timeframe Analysis
- - Confirm overall trend direction on H4
- - Wait for arrow signals on H1
- - Find precise entry points on M15
- 3. Parameter Optimization
- - Scalping / Short-term trading: BBperiod=10, ATRperiod=3
- - Swing trading: BBperiod=21, ATRperiod=5 (Default)
- - Long-term trading: BBperiod=50, ATRperiod=10
- ========================================
- [Trading Strategy Examples]
- ========================================
- [Strategy 1: Trend Following Strategy]
- 1. Wait for a green upward arrow to appear.
- 2. Wait for price to pull back near the blue trend line.
- 3. Enter a buy position when a bullish candlestick pattern forms.
- 4. Set stop loss below the trend line.
- 5. Hold position until a yellow downward arrow appears.
- [Strategy 2: Breakout & Retest Strategy]
- 1. Observe changes in the trend line color.
- 2. Blue changing to red = Beginning of a downtrend.
- 3. Wait for price to rally back to the trend line.
- 4. Enter a short position near the trend line.
- 5. Set stop loss above the trend line.
- [Strategy 3: Conservative Trading Strategy]
- 1. Set TypeOfArrows = High_Low_Open_Close.
- 2. Trade only when an arrow appears.
- 3. Wait for price to confirm a breakout of the trend line.
- 4. Trail stop loss strictly along the trend line after entering.
- 5. Target a risk-reward ratio of 1:2 to 1:3.
- ========================================
- [Supported Assets]
- ========================================
- ✅ Forex Currency Pairs
- - Major pairs: EURUSD, GBPUSD, USDJPY, etc.
- - Cross pairs: EURJPY, GBPJPY, etc.
- - Ideal for strongly trending currency pairs
- ✅ Precious Metals
- - Gold (XAUUSD) - Highly effective
- - Silver (XAGUSD)
- ✅ Crude Oil
- - WTI Crude Oil
- - Brent Crude Oil
- ✅ Indices
- - Dow Jones Index (US30)
- - NASDAQ Index (NAS100)
- - S&P 500 Index (US500)
- ========================================
- [Recommended Timeframes]
- ========================================
- - Scalping: M5, M15 (Fast entry and exit)
- - Short-term: M30, H1 (Intraday trading)
- - Swing trading: H4, D1 ★ Recommended
- - Long-term: W1 (Position / Trend trading)
- **Best Timeframes: H4 and D1**
- - High signal quality
- - Fewer false signals
- - Suitable for most traders
- ========================================
- [Key Advantages]
- ========================================
- ✅ Simple & Intuitive
- - Clear and easy-to-read trend line
- - Visual arrow signals at a glance
- - Beginners can get started quickly
- ✅ Dynamic Stop Loss
- - Automatic trend line adjustments
- - Serves as a dynamic trailing stop reference
- - Protects profits and manages risk
- ✅ Multiple Modes
- - 4 arrow display modes
- - Adaptable to your trading style
- - Flexible for different market conditions
- ✅ Alert Notifications
- - Automatic alerts on trend reversal
- - Ensures you never miss a trading opportunity
- - Supports pop-up alerts
- ========================================
- [Important Notes / Limitations]
- ========================================
- ⚠️ Limitations of Trend Indicators
- - Underperforms in ranging/sideways markets
- - Inherent lag during trend reversals
- - Recommended to combine with other indicators for confirmation
- ⚠️ Parameters Need Optimization
- - Different instruments require different settings
- - Parameters should be adjusted based on timeframes
- - Test on a demo account before live trading
- ⚠️ Risk Management is Essential
- - Always set a stop loss for every trade
- - Manage your position sizing properly
- - Avoid overtrading
- ⚠️ Conditions to Avoid
- - Around major economic news releases
- - Low liquidity periods
- - Highly consolidated ranging markets
- ========================================
- [Trading Tips]
- ========================================
- 1. Trend Line as Support / Resistance
- - Price tends to bounce after touching the trend line multiple times
- - The trend line acts as a key support/resistance dynamic level
- - Look for potential entry opportunities near the trend line
- 2. Signal Confirmation
- - Do not follow arrow signals blindly
- - Wait for price to confirm the breakout
- - Combine with candlestick price action
- 3. Stop Loss Setup
- - Initial SL: Just beyond the trend line
- - Trailing SL: Adjust along with the moving trend line
- - Profit Protection: Lock in partial profits
- 4. Exit Strategy
- - Opposite arrow signal appears
- - Price breaks through the trend line
- - Take-profit target reached
- ========================================
- [Frequently Asked Questions]
- ========================================
- Q: Why do arrows appear frequently at times and rarely at other times?
- A: This depends on market conditions. Trending markets generate fewer but higher-quality signals,
- while ranging markets produce more arrows with higher false signal rates. You can adjust the BBperiod
- and BBdeviations parameters to control signal frequency.
- Q: Why does the trend line jump or repaint dynamically?
- A: This is normal behavior. The trend line dynamically adjusts to price changes,
- especially during the early stage of a trend. Enabling UseATRfilter can help
- reduce line jumpiness.
- Q: How can I reduce false signals?
- A: 1. Increase BBperiod (e.g., to 30 or 50)
- 2. Increase BBdeviations (e.g., to 1.5 or 2)
- 3. Use higher timeframes (such as H4 or D1)
- 4. Set TypeOfArrows to a filtered mode (e.g., Open_Cose_Median or High_Low_Open_Close)
- Q: What should I do if price moves in the opposite direction after an arrow appears?
- A: This indicates a false signal. We recommend:
- 1. Avoid entering immediately when an arrow appears
- 2. Wait for price to confirm breaking the trend line
- 3. Always set a strict stop loss
- 4. Filter signals using higher timeframes
- Q: Can this indicator be used for scalping?
- A: It is not ideal for scalping due to inherent trend lag; it is best suited for swing trading.
- If you want to scalp, use M1 or M5 timeframes
- and lower the BBperiod parameter value.
- ========================================
- [Recommended Settings]
- ========================================
- [Aggressive Traders]
- BBperiod = 10
- BBdeviations = 0.8
- ATRperiod = 3
- UseATRfilter = TRUE
- TypeOfArrows = Simple_Arrows
- [Moderate / Balanced Traders]
- BBperiod = 21 (Default)
- BBdeviations = 1 (Default)
- ATRperiod = 5 (Default)
- UseATRfilter = TRUE
- TypeOfArrows = Open_Cose_Median
- [Conservative Traders]
- BBperiod = 50
- BBdeviations = 2
- ATRperiod = 10
- UseATRfilter = TRUE
- TypeOfArrows = High_Low_Open_Close
Applications & Use Cases
This product is suitable for traders seeking MT4 indicator resources for strategy backtesting, chart analysis, account management, or automated trading support. We strongly recommend testing parameters and compatibility in a demo account environment before live application.