
 Practical trading resource
Forex Compounding Calculator
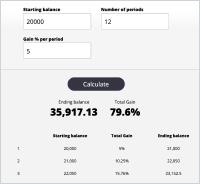
The Forex Compounding Calculator is an essential tool for forex traders, helping you project and calculate the impact of compounding on your trading account.
Trading calculation workspace
Enter your planning values to organise a clear risk estimate before placing a trade.
Planning estimate
About Forex Compounding Calculator

Use our Forex Drawdown Calculator to accurately simulate how a series of losing trades will impact your trading account equity, helping you build better risk management and stop-loss strategies.
What is Forex Drawdown?
Forex drawdown refers to the peak-to-trough decline in account equity, expressed as a percentage. In simple terms, it shows the percentage of capital lost over a period. Excessive drawdown not only increases the risk of a stop-out or margin call, but it also places immense psychological stress on a trader.
A drawdown calculator helps you simulate the maximum potential equity decline based on different risk levels and consecutive loss streaks, enabling you to avoid losses beyond your risk tolerance during live trading.
How to Use the Forex Drawdown Calculator
Starting Balance: Enter your current or planned account equity, such as 1,000 or 20,000.
Consecutive Losing Trades: Simulate a worst-case scenario of how many losing trades you might experience in a row, such as 6, 10, or 20 trades.
Loss Percentage Per Trade: Set the maximum risk percentage you plan to take per trade. It is generally recommended to keep this between 0.5% and 2% of your total equity.
Once you enter these parameters, click "Calculate". The tool will display your ending balance, total monetary loss, maximum drawdown percentage, and a breakdown of your equity after each losing trade.
How to Interpret Drawdown Results?
If the simulation results show that your drawdown stays within 10% over the long term, it indicates conservative risk control. A drawdown between 20% and 30% reflects noticeable equity fluctuations. A drawdown exceeding 40% significantly increases the risk of margin calls and emotional burnout, typically requiring a re-evaluation of your position sizes and trading system.
Combining with Other Risk Management Tools
Drawdown is just one component of overall risk management. When developing your trading plan, we recommend using it alongside the Position Size and Risk Calculator and the Risk of Ruin Calculator to comprehensively evaluate per-trade risk, consecutive losses, and stop-out probabilities, helping smooth out your equity curve.
Forex Drawdown Calculation FAQs
1. What is considered a healthy drawdown in forex trading?
Generally, maintaining a long-term drawdown within 10% is considered healthy. Temporary drawdowns of 20%–30% are common in trend-following or high-volatility strategies, but they require proper psychological preparation and capital planning. A drawdown exceeding 40% typically indicates oversized positions or an unstable trading system, requiring immediate adjustments.
2. Is drawdown calculated based on floating loss or closed loss?
This tool defaults to calculating drawdown using "realized losses" (losses after closing positions), making it ideal for evaluating the actual performance of a trading system. However, for real-time risk control, it is advisable to monitor floating losses as well, as large floating losses can still trigger margin calls or stop-outs.
3. What is an appropriate risk level per trade?
Most money management models recommend keeping per-trade risk within 0.5%–2% of total account equity. You can test maximum drawdowns under different risk percentages using the Drawdown Calculator to find an optimal range that aligns with your risk tolerance and profit targets.
4. Is a smaller drawdown always better?
An extremely small drawdown usually reflects a very conservative risk approach, but it may also result in lower returns. The key is striking a balance between drawdown size and profit targets. Simulating different parameter combinations with the Drawdown Calculator helps you identify the ideal risk-reward ratio for your trading style.
5. How can I use drawdown results to optimize my trading system?
Through historical backtesting or hypothetical scenarios, you can input your strategy's win rate, risk-reward ratio, and consecutive loss count into the Drawdown Calculator. By observing how maximum drawdown changes across different position sizes, you can fine-tune your stop-loss, profit targets, and trade frequency for a smoother equity curve.
6. How much gain is required to recover from a drawdown?
The larger the drawdown, the higher the percentage gain required to recover to the initial account value. For example, a 20% drawdown requires roughly a 25% gain to break even, while a 50% drawdown requires a 100% gain to recover. Controlling drawdown size is far more vital than desperately chasing losses after the fact.
Related trading tools
Explore more resources for risk, margin and trade planning.
Forex Spread Calculator
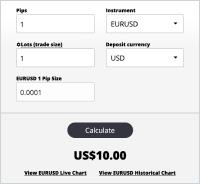
The Forex Spread Calculator is an essential tool for forex traders, helping you accurately calculate spreads across different currency pairs.
Use this tool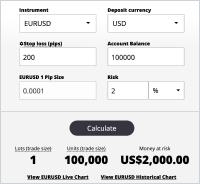
Position Size and Risk Calculator
The Forex position size and risk calculator is an indispensable tool in forex trading.
Use this tool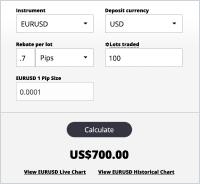
Forex Cashback Calculator
Forex cashback and rebate calculators are essential tools for forex traders, helping you maximize your trading profits.
Use this tool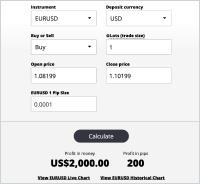
Forex Profit Calculator
The Profit and Cashback Calculator is a powerful tool for forex traders, helping you accurately calculate potential profits and cashback for your trades.
Use this tool
Forex Compounding Calculator
The Forex Compounding Calculator is an essential tool for forex traders, helping you project and calculate the impact of compounding on your trading account.
Use this tool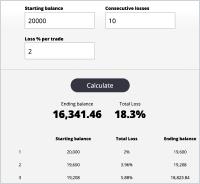
Drawdown Calculator
Use our Forex Drawdown Calculator to accurately calculate how a series of losing trades impacts your trading account balance.
Use this tool