Product details
Trend Indicator Product Overview
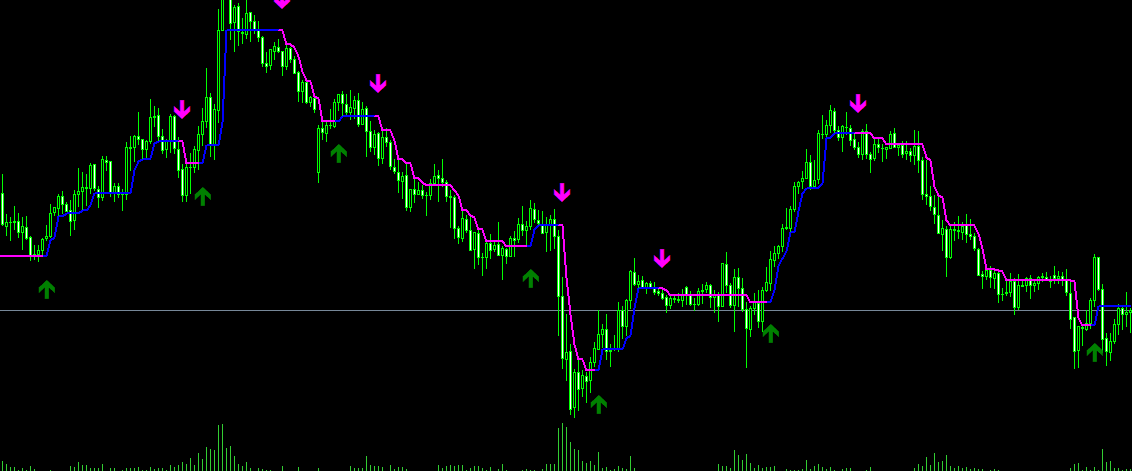
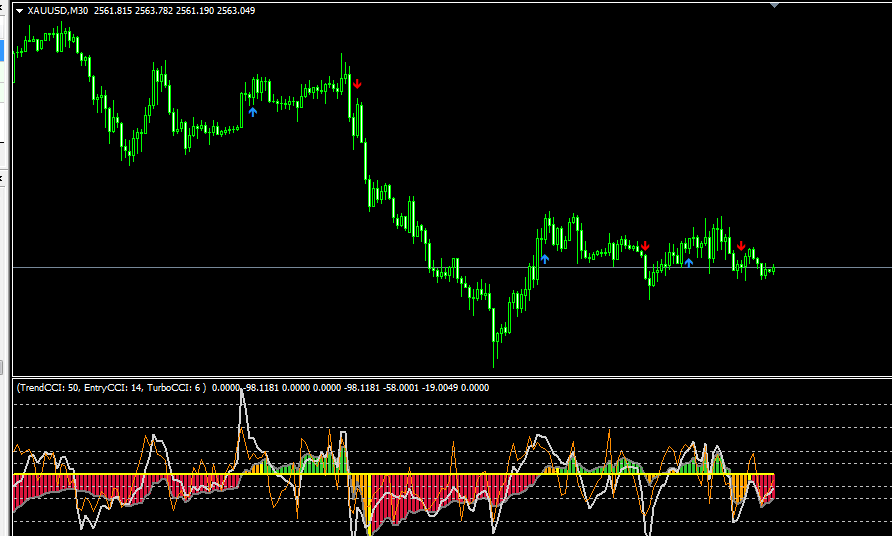
- The Trend 1 Indicator focuses on moving average crossover signals. By monitoring
- the crossovers between fast and slow moving averages, it displays buy and sell signals as arrows on the chart,
- helping traders quickly identify potential trend reversals.
- 【Key Features】
- - Automatically detects fast and slow moving average crossover points
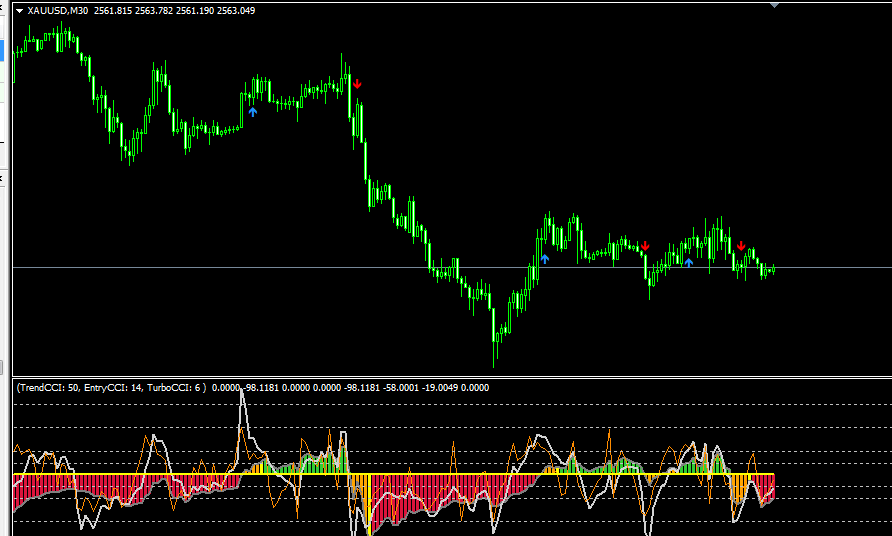
- - Blue up-arrow indicates a Buy signal
- - Red down-arrow indicates a Sell signal
- - Supports 4 moving average types: SMA, EMA, SMMA, and LWMA
- - Arrow positions dynamically adjust based on ATR so they do not obstruct candlestick bars
- ========================================
- 【Indicator Logic】
- ========================================
The indicator determines crossover signals based on the following logic:
- 1. Calculates two moving averages:
- - Fast Moving Average (Default: EMA 13 periods)
- - Slow Moving Average (Default: EMA 25 periods)
- 2. Determines crossover conditions (Confirmed across 3 candlesticks):
- - Current Bar: Fast MA > Slow MA
- - Previous Bar: Fast MA < Slow MA (Crossover just occurred)
- - Next Bar: Fast MA > Slow MA (Confirms valid crossover)
- 3. Arrow Positioning:
- - Buy Arrow: Candlestick Low - ATR × 0.5 (below the candlestick)
- - Sell Arrow: Candlestick High + ATR × 0.5 (above the candlestick)
- - ATR is calculated based on 10 bars to dynamically adjust offset spacing
- ========================================
- 【Parameter Settings】
- ========================================
- FasterMode = 1 (EMA)
- - Fast Moving Average calculation method
- - 0 = SMA (Simple Moving Average)
- - 1 = EMA (Exponential Moving Average, default)
- - 2 = SMMA (Smoothed Moving Average)
- - 3 = LWMA (Linear Weighted Moving Average)
- FasterMA = 13
- - Fast Moving Average period (Default: 13)
- - Lower values increase sensitivity
- - Recommended range: 5 - 20
SlowerMode = 1 (EMA)
- Slow Moving Average calculation method (same options as above)
- SlowerMA = 25
- - Slow Moving Average period (Default: 25)
- - Higher values provide smoother trend stability
- - Recommended range: 20 - 50
- ========================================
- 【Signal Explanation】
- ========================================
- ✅ Blue Up-Arrow (Buy Signal)
- - Fast MA crosses above Slow MA
- - Appears below the candlestick bar
- - Indicates the start of an uptrend
- ✅ Red Down-Arrow (Sell Signal)
- - Fast MA crosses below Slow MA
- - Appears above the candlestick bar
- - Indicates the start of a downtrend
- ========================================
- 【How to Use】
- ========================================
- 【Basic Strategy】
- 1. Consider buying when a blue up-arrow appears
- 2. Consider selling when a red down-arrow appears
- 3. Wait for the candlestick to close before entering to confirm the signal
- 4. Set the stop-loss on the opposite side of the signal candlestick
- 【Advanced Strategy】
- 1. Filter signals using the overall trend direction
- - Only trade crossover signals that align with the main trend
- - Take only Buy signals during an uptrend
- - Take only Sell signals during a downtrend
- 2. Recommended Parameter Optimization
- - Short-term: FasterMA = 5, SlowerMA = 13
- - Medium-term: FasterMA = 13, SlowerMA = 25 (Default)
- - Long-term: FasterMA = 20, SlowerMA = 50
- 3. Multi-Timeframe Confirmation
- - Use higher timeframes to confirm trend direction
- - Use lower timeframes to wait for crossover signals
- - Enter when both timeframe directions align
Applicable Scenarios
This tool is suitable for traders seeking MT4 indicator resources for strategy testing, chart analysis, account management, or automated trading assistance. It is recommended to test the settings and compatibility in a demo account environment before live application.