Product details
HalfTrend-1.02 Product Overview
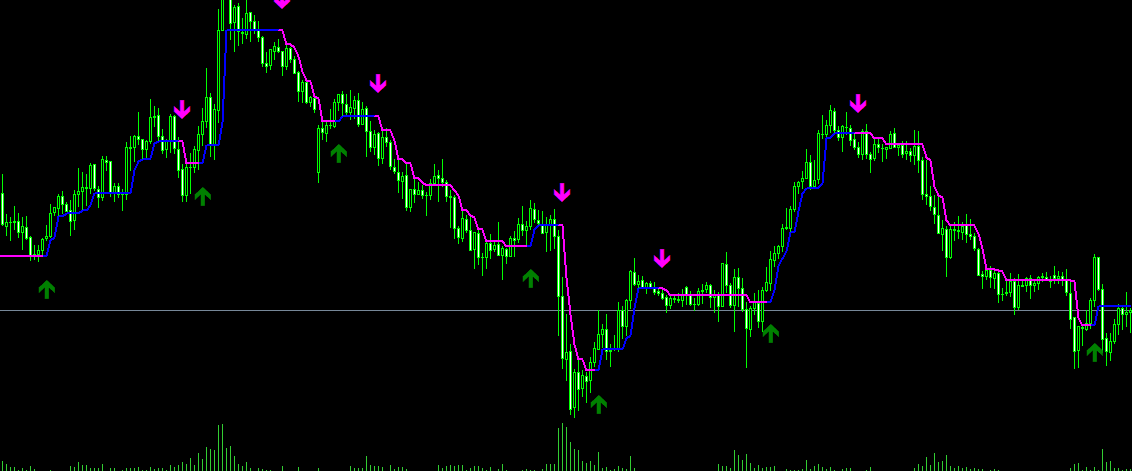
- HalfTrend is a classic trend-following indicator that determines trend direction by dynamically tracking price high and low points,
- providing clear buy and sell signals during trend reversals. The indicator visually displays market direction through trend lines and
- arrows, making it suitable for all trading styles.
- [Key Features]
- - Dynamic trend line tracks price movement in real time
- - Buy and sell arrow signals displayed during trend reversals
- - ATR channel displays price volatility range
- - Supports multiple alerts: pop-up windows, sound, and email notifications
- - Customizable sensitivity and visual display styles
- ========================================
- [Indicator Principles]
- ========================================
HalfTrend determines market trends using the following logic:
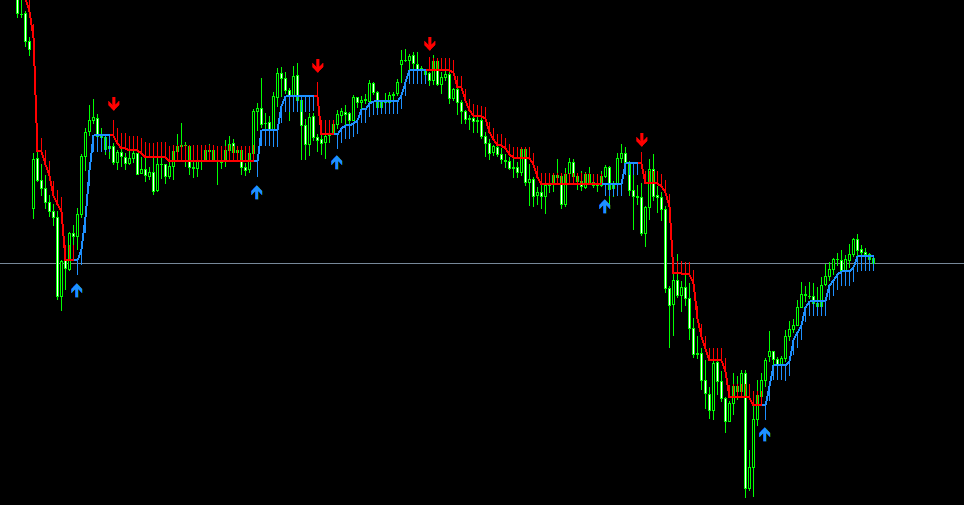
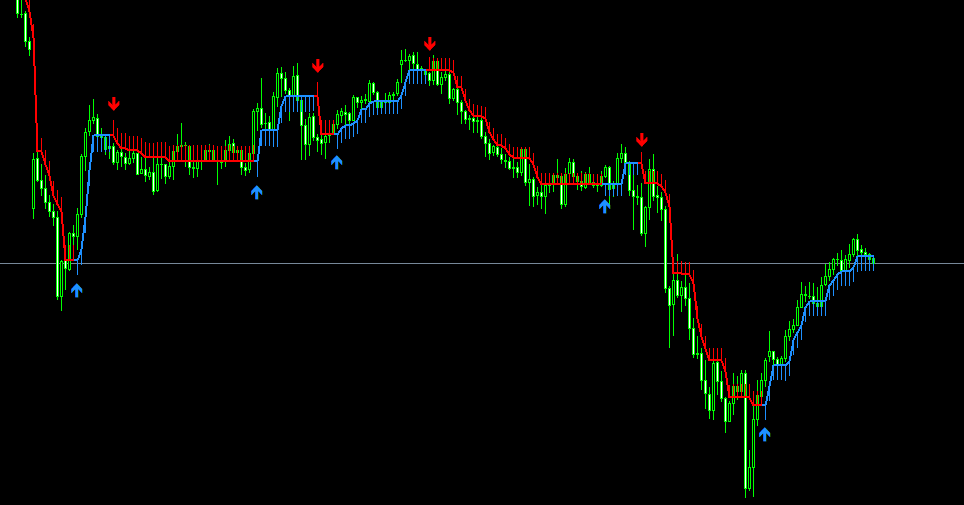
- 1. Uptrend (Blue Line)
- - Tracks the lowest price over a specified period
- - The trend line only moves upward, never downward
- - Trend shifts when price breaks below the trend line
- 2. Downtrend (Red Line)
- - Tracks the highest price over a specified period
- - The trend line only moves downward, never upward
- - Trend shifts when price breaks above the trend line
- 3. ATR Channel (Thin Lines)
- - Thin blue line: ATR reference line for uptrends
- - Thin red line: ATR reference line for downtrends
- - Displays the normal volatility range of price
- 4. Arrow Signals
- - Blue upward arrow: Trend changes from bearish to bullish (Buy signal)
- - Red downward arrow: Trend changes from bullish to bearish (Sell signal)
- ========================================
- [Parameter Settings]
- ========================================
- Amplitude = 2
- - Indicator sensitivity (core parameter)
- - Smaller values produce more frequent signals, suitable for short-term trading
- - Larger values produce fewer signals, suitable for medium to long-term trading
- - Recommended range: 1-5
- ShowBars = true
- - Whether to display the ATR channel lines
- - true: Displays the thin blue/red channel lines
- - false: Displays only the main trend line
- ShowArrows = true
- - Whether to display buy/sell arrows
- - true: Displays arrows during trend reversals
- - false: Displays only trend lines, hides arrows
- alertsOn = true
- - Whether to enable alert function
- - true: Triggers alerts during trend reversals
- - false: Disables all alerts
- alertsOnCurrent = false
- - Alert timing selection
- - false: Alerts after the candlestick closes (Recommended)
- - true: Alerts immediately when a signal appears on the current candlestick
- alertsMessage = true
- - Whether to enable pop-up alerts
- - true: Displays a pop-up alert window
- alertsSound = true
- - Whether to enable sound alerts
- - true: Plays an audio alert
- alertsEmail = false
- - Whether to enable email alerts
- - true: Sends email notifications (requires email setup)
- ========================================
- [How to Use]
- ========================================
[Basic Usage]
- 1. Trend Identification
- - Blue line appears = Uptrend, focus primarily on buying/going long
- - Red line appears = Downtrend, focus primarily on selling/going short
- - The steeper the trend line, the stronger the trend
- 2. Entry Signals
- - Blue upward arrow appears = Buy signal
- - Red downward arrow appears = Sell signal
- - Recommended to wait for candlestick close confirmation before entering
- 3. Stop Loss Setup
- - Long positions: Set stop loss below the trend line
- - Short positions: Set stop loss above the trend line
- - The trend line adjusts dynamically, serving as a trailing stop loss
- 4. Exit Timing
- - Close positions when an opposite arrow appears
- - Close positions when price breaks through the trend line
- - Close positions when target profit is reached
[Advanced Usage]
- 1. Multi-Timeframe Analysis
- - Confirm trend direction on H4
- - Wait for arrow signals on H1
- - Execute precise entries on M30
- 2. Combining with ATR Channel
- - Price fluctuations within the channel are considered normal
- - Price breaking out of the channel may indicate a strong momentum signal
- - Channel width reflects market volatility level
- 3. Parameter Optimization
- - Short-term: Amplitude=1, alertsOnCurrent=true
- - Medium-term: Amplitude=2 (Default)
- - Long-term: Amplitude=3-5
- ========================================
- [Trading Strategy Examples]
- ========================================
- [Strategy 1: Trend Following Strategy]
- 1. Wait for a blue upward arrow to appear
- 2. Confirm the candlestick closes above the trend line
- 3. Buy at the open of the next candlestick
- 4. Set stop loss below the trend line
- 5. Close position when a red downward arrow appears
- [Strategy 2: Pullback Entry Strategy]
- 1. Confirm current uptrend (blue line)
- 2. Wait for price to pull back near the trend line
- 3. Buy when price finds support at the trend line
- 4. Set stop loss below the trend line
- 5. Hold position until trend reversal
- [Strategy 3: Multi-Timeframe Strategy]
- 1. Confirm trend direction on the H4 chart
- 2. Wait for same-direction arrow signal on the H1 chart
- 3. Look for precise entry points on the M15 chart
- 4. Strictly set stop loss according to the trend line
- 5. Target profit at 2-3 times the risk ratio
Applications & Use Cases
This product is ideal for traders looking for MT4 indicator resources for strategy testing, chart analysis, account management, or automated trading assistance. It is recommended to test parameters and compatibility in a demo account environment before live application.