Product details
StopReversal Overview
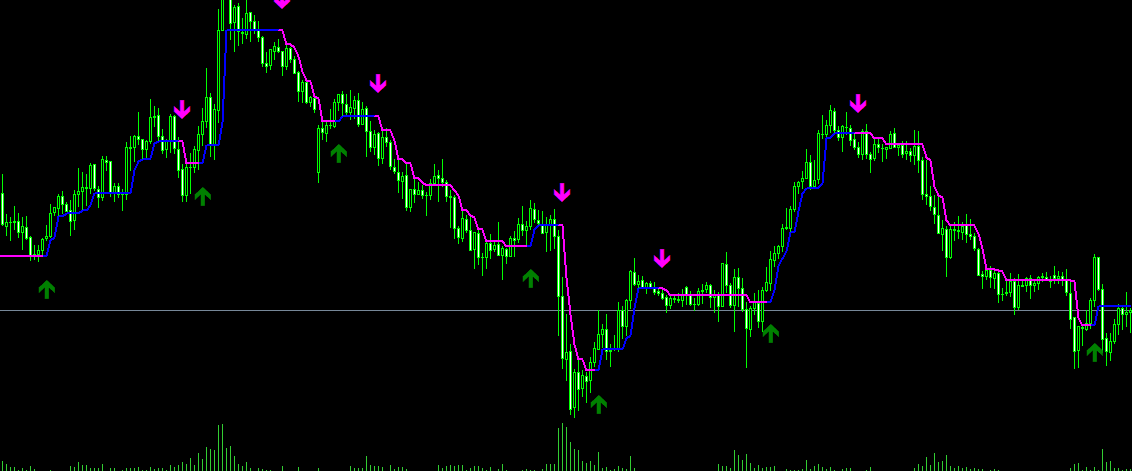
- StopReversal is a trend reversal indicator based on the principle of trailing stop loss. By dynamically
- tracking the percentage offset from the closing price, it identifies trend inflection points and provides
- clear buy/sell signals when a trend reverses.
- [Key Features]
- - Dynamically tracks price trends
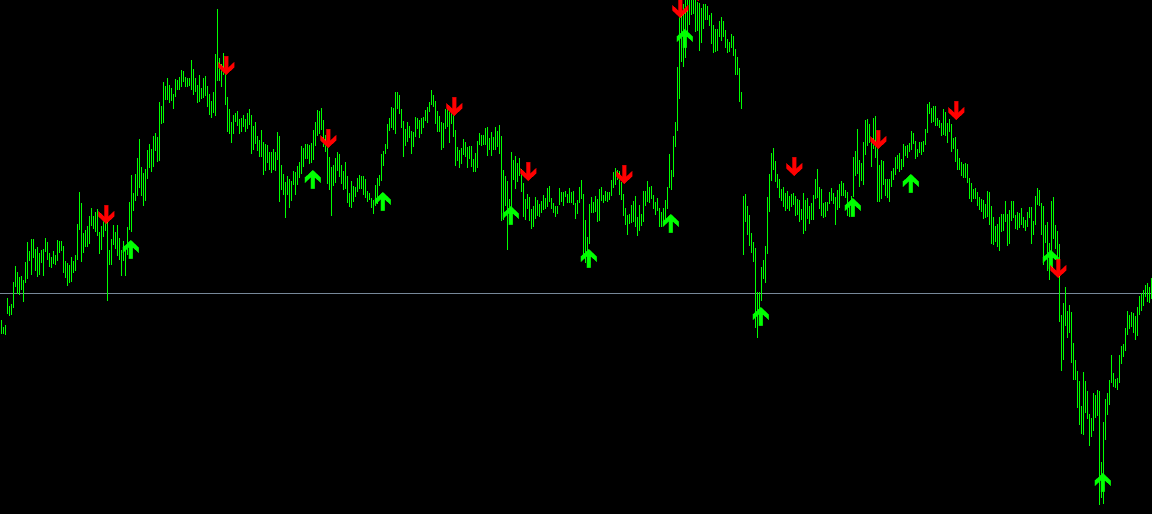
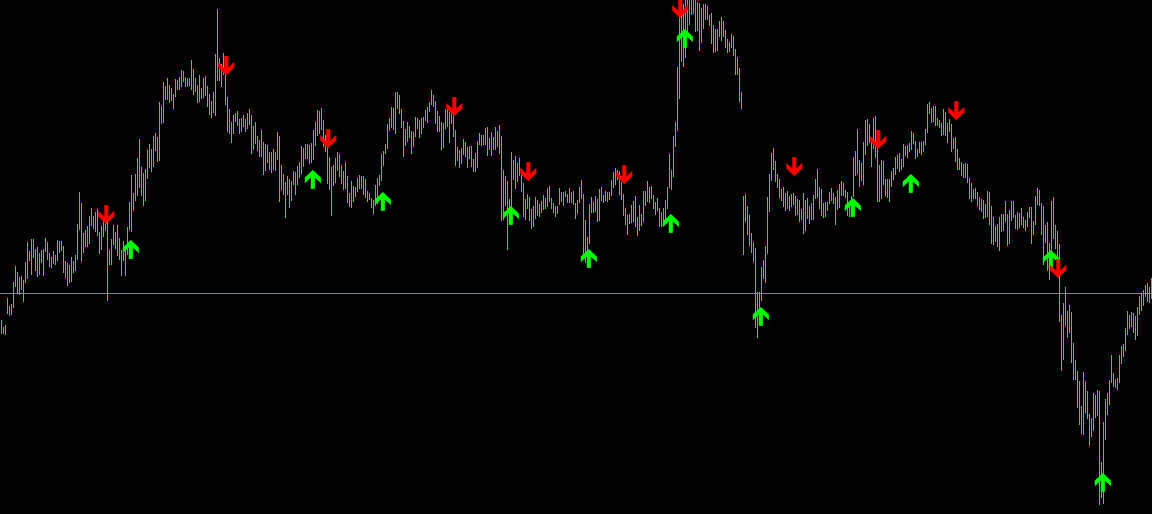
- - Displays buy/sell arrows upon trend reversal
- - Based on percentage offset, adaptable to various instruments
- - Simple logic with clear signals
- ========================================
- [Indicator Principles]
- ========================================
The indicator tracks trends using the following logic:
- 1. Uptrend
- - Trailing Stop Line = Closing Price × (1 - nPips)
- - The stop line only moves up, never down
- - A trend reversal occurs when price drops below the stop line
- 2. Downtrend
- - Trailing Stop Line = Closing Price × (1 + nPips)
- - The stop line only moves down, never up
- - A trend reversal occurs when price breaks above the stop line
- 3. Signal Display
- - Green Up Arrow: Trend turns bullish; Buy signal
- - Red Down Arrow: Trend turns bearish; Sell signal
- ========================================
- [Parameter Settings]
- ========================================
- nPips = 0.004
- - Trailing stop percentage offset (Core parameter)
- - Default value: 0.004 = 0.4%
- - Smaller value: More frequent signals, tighter stop loss
- - Larger value: Fewer signals, looser stop loss
- - Recommended range: 0.001 - 0.01
[Parameter Adjustment Recommendations]
- Forex Currency Pairs:
- - Short-term: nPips = 0.001 - 0.002
- - Medium-term: nPips = 0.003 - 0.005 (Default)
- - Long-term: nPips = 0.006 - 0.010
- Gold (XAUUSD):
- - Short-term: nPips = 0.002 - 0.003
- - Medium-term: nPips = 0.004 - 0.006
- - Long-term: nPips = 0.007 - 0.010
- Crude Oil:
- - Short-term: nPips = 0.003 - 0.005
- - Medium-term: nPips = 0.005 - 0.008
- ========================================
- [How to Use]
- ========================================
[Basic Usage]
- 1. Trend Identification
- - Green arrow appears = Uptrend begins
- - Red arrow appears = Downtrend begins
- - The range between arrows represents the position holding phase
- 2. Entry Signals
- - Green up arrow appears = Buy
- - Red down arrow appears = Sell
- - Recommended to wait for candlestick close confirmation
- 3. Stop Loss Setting
- - Use the price when the arrow appears as a reference
- - Set the stop loss on the opposite side of the arrow price
- - Estimate stop loss distance based on the nPips parameter
- 4. Exit Timing
- - Close position when a reverse arrow appears
- - Close position when profit target is reached
[Advanced Usage]
- 1. Multi-Timeframe Confirmation
- - Higher timeframe to confirm trend direction
- - Lower timeframe to wait for entry signals
- - Trade with the trend to increase win rate
- 2. Combine with Support & Resistance
- - Buy signals near key support levels are more reliable
- - Sell signals near key resistance levels are more reliable
- - Avoid entering in the middle of key price levels
Applications
This product is suitable for traders who require MT4 indicator resources for strategy testing, chart analysis, account management, or automated trading assistance. It is recommended to test parameters and compatibility in a demo account environment before actual live trading.