Product details
Today Trend Product Overview
- Today Trend is an intraday trend indicator based on the previous day's high and low prices. By analyzing
- the previous day's price range, it calculates the current day's support, resistance, and pivot points, automatically determines the trading direction for the day at market open,
- and provides buy/sell signals, target prices, and stop-loss/reversal levels.
- [Key Features]
- - Automatically determines the daily trend direction based on the previous day's high and low
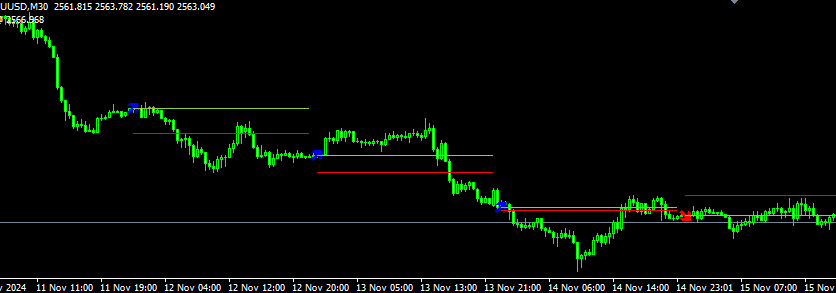
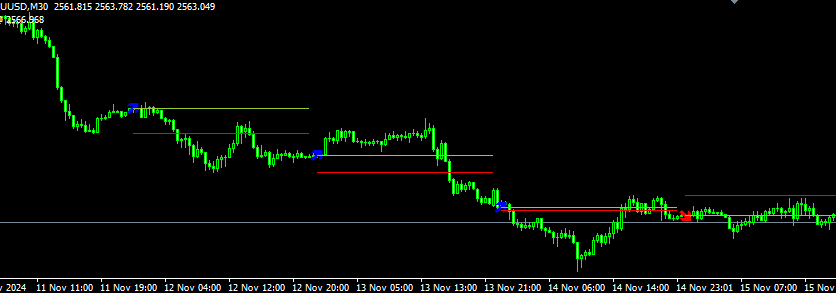
- - Displays buy/sell arrow signals at the daily market open
- - Displays target profit price lines (green)
- - Displays stop-loss/reversal price lines (red)
- - Applicable to daily and all lower timeframes
- ========================================
- [Indicator Principle]
- ========================================
The indicator performs the following calculations at the daily market open (00:00):
- 1. Fetch Previous Day Data
- - Previous day High (H)
- - Previous day Low (L)
- - Current day Open (O)
- 2. Calculate Key Levels
- - Price Range: Spread = H - L
- - Pivot Offset: Pivot = Spread × 2 / 5
- - Resistance Level: R = H - Pivot
- - Support Level: S = L + Pivot
3. Determine Trading Direction (Three Scenarios)
Scenario 1 (Open is between Resistance and High):
- Open < High and Open > Resistance → Go Short
- Scenario 2 (Open is between Support and Resistance):
- - Open < Support → Go Long
- - Open is closer to Resistance → Go Short
- - Open is closer to Support → Go Long
- Scenario 3 (Open breaks previous day's High/Low):
- - Open >= High → Go Long
- - Open <= Low → Go Short
- 4. Calculate Stop-Loss/Reversal Price
- - When Going Long: Stop-Loss/Reversal = Previous day Low
- - When Going Short: Stop-Loss/Reversal = Previous day High
- ========================================
- [Parameter Settings]
- ========================================
- PROFIT_TARGET = 30
- - Target profit in pips (Default: 30 pips)
- - When Going Long: Target Price = Open Price + 30 pips
- - When Going Short: Target Price = Open Price - 30 pips
- - Can be adjusted according to asset class and trading style
- SHOW_TARGET = true
- - Whether to display the profit target line
- - true: Display green target price line
- - false: Hide target price line
- SHOW_REVERSAL = true
- - Whether to display the stop-loss/reversal line
- - true: Display red stop-loss/reversal price line
- - false: Hide stop-loss/reversal price line
- ========================================
- [Signal Description]
- ========================================
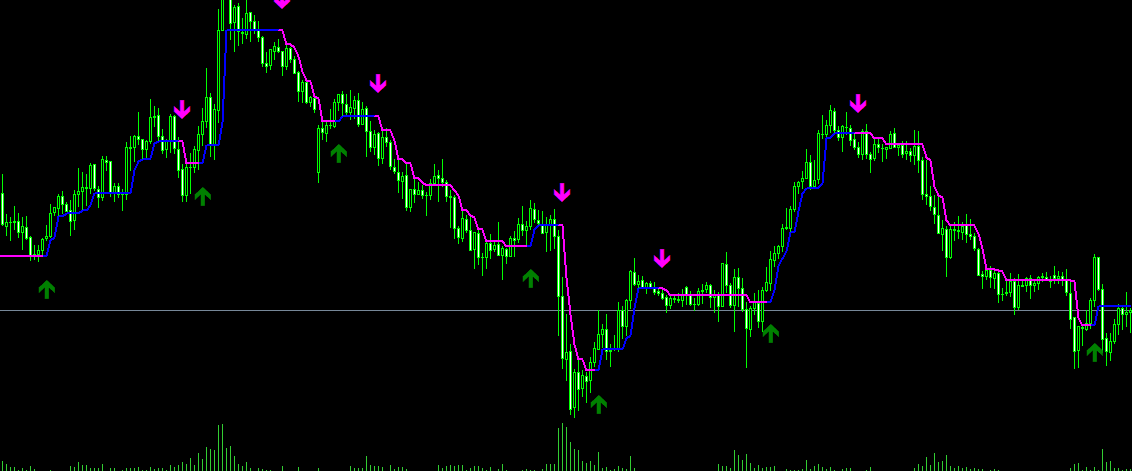
- ✅ Blue Upward Arrow (Go Long)
- - Appears at daily market open
- - Represents a Buy signal
- - Recommended to buy near the Open price
- ✅ Red Downward Arrow (Go Short)
- - Appears at daily market open
- - Represents a Sell signal
- - Recommended to sell near the Open price
- ✅ Green Target Line (Profit Target Line)
- - Displays the target profit level for the day
- - Above Open price when going long
- - Below Open price when going short
- ✅ Red Stop Line (Stop/Reversal Line)
- - Displays stop-loss and reversal price levels
- - Consider stopping loss or reversing position when price touches this line
- ========================================
- [How to Use]
- ========================================
[Basic Usage]
- 1. Wait for Daily Open (00:00)
- - The indicator automatically calculates at daily open
- - Enter trade when arrow signal appears
- 2. Long Trade Execution
- - Blue upward arrow appears
- - Buy near the Open price
- - Set stop-loss below the red stop line
- - Set target at the green target line
- 3. Short Trade Execution
- - Red downward arrow appears
- - Sell near the Open price
- - Set stop-loss above the red stop line
- - Set target at the green target line
[Advanced Usage]
- 1. Adjust Profit Target
- - Adjust PROFIT_TARGET based on asset volatility
- - Gold: Recommended 50-100 pips
- - Forex: Recommended 20-50 pips
- - Crude Oil: Recommended 30-60 pips
- 2. Combine with Other Analysis
- - Filter signals using daily trend direction
- - Trade only in the direction of the trend
- - Exercise caution near major support and resistance levels
- 3. Multi-Timeframe Usage
- - Can be used on M5, M15, M30, H1, H4, and other timeframes
- - Signals appear at daily market open
- - Lower timeframes allow for more precise entry points
- ========================================
- [Trading Strategy Examples]
- ========================================
- [Strategy 1: Market Open Signal Strategy]
- 1. Wait for signal to appear at daily 00:00
- 2. Buy at Open price when blue arrow appears
- 3. Set stop-loss 10 pips below the red stop line
- 4. Set target at the green target line
- 5. Close position before daily market close if target is not reached
- [Strategy 2: Breakout Confirmation Strategy]
- 1. Wait for open signal to appear
- 2. Do not enter immediately; wait for price to confirm direction
- 3. Long: Buy after price breaks above Open price
- 4. Short: Sell after price breaks below Open price
- 5. Set stop-loss at the stop line opposite to the signal
- [Strategy 3: Conservative Strategy]
- 1. Trade only when the trend is clear
- 2. When a Long signal appears, confirm that the daily chart is also in an uptrend
- 3. When a Short signal appears, confirm that the daily chart is also in a downtrend
- 4. Trade with the trend to improve win rate
Target Audience & Use Cases
This product is suitable for traders who need MT4 indicator resources for strategy testing, chart analysis, account management, or automated trading support. It is recommended to test settings and compatibility in a demo account environment before live application.