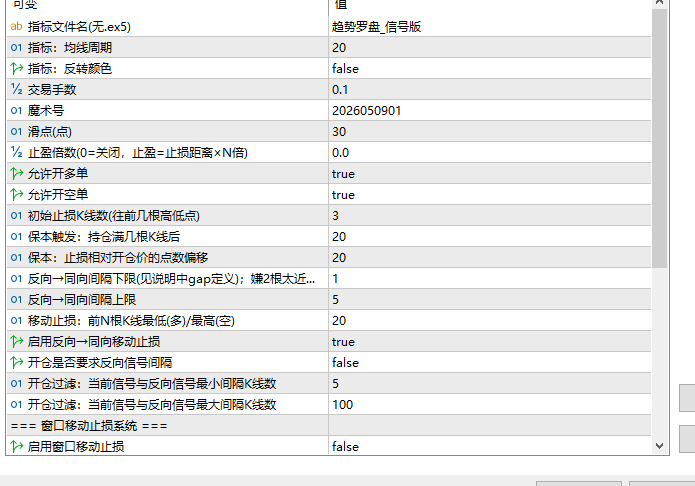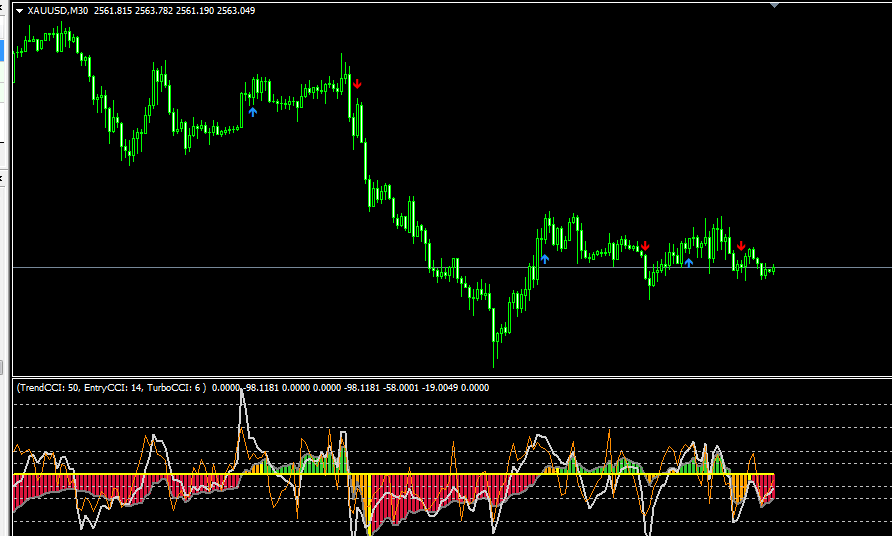
Product details
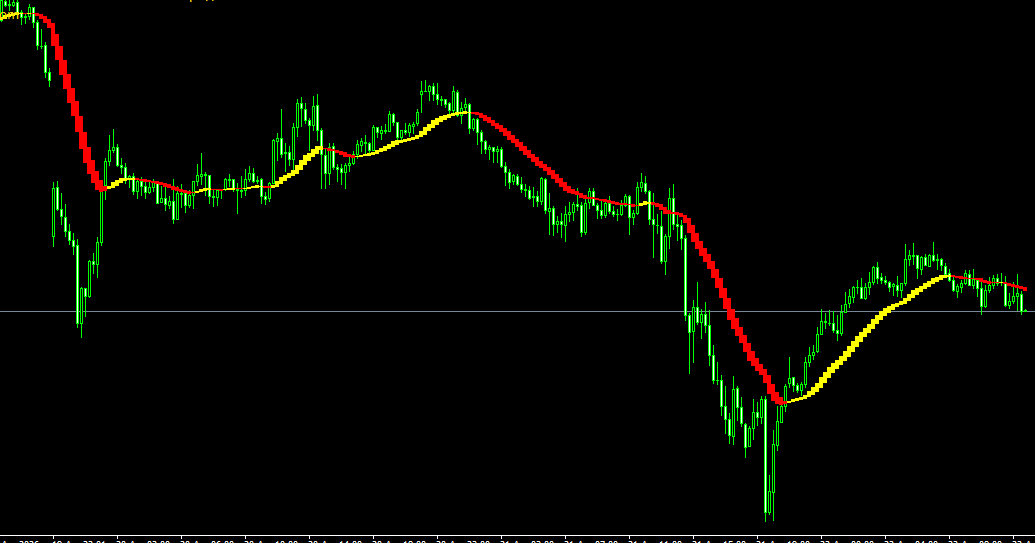
Trend Compass - Product Overview
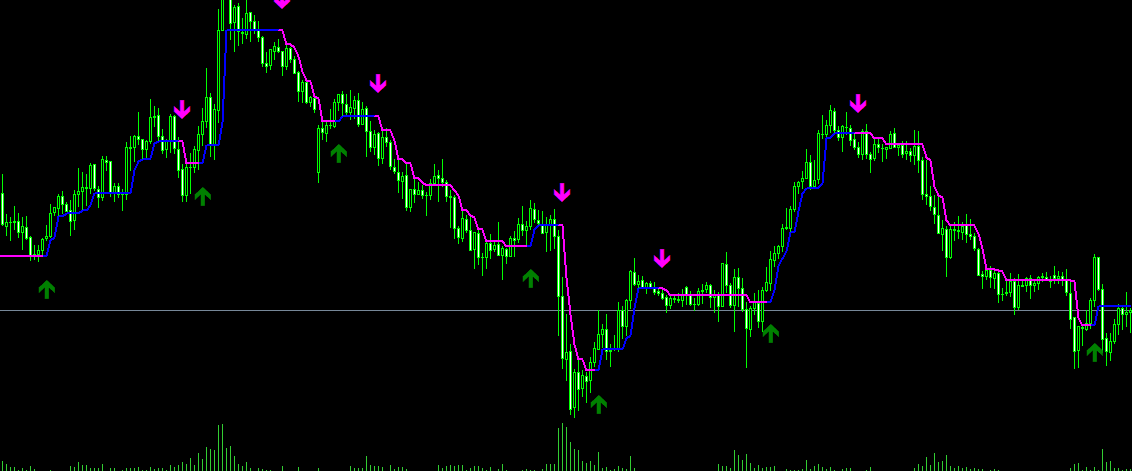
- Trend Compass is a trend-determination indicator based on multiple moving averages. By comprehensively calculating
- the moving averages of Close, High, Low, and Open prices, it forms a dynamic trend channel that
- visually displays current market direction and trend strength.
- [Key Features]
- - Dynamic trend channel tracks price action in real time
- - Red channel indicates a downtrend
- - Blue channel indicates an uptrend
- - Channel width reflects trend strength
- - Ideal for identifying trend direction and entry timing
- ========================================
- [Indicator Principle]
- ========================================
The indicator calculates the trend channel through the following steps:
- 1. Calculate four moving averages
- - Close EMA (20-period)
- - Low EMA (20-period)
- - Open EMA (20-period)
- - High EMA (20-period)
2. Calculate composite mean
- The average of the four moving averages serves as the trend center line
- 3. Determine trend direction
- - Current composite mean > Previous composite mean = Uptrend (Blue)
- - Current composite mean < Previous composite mean = Downtrend (Red)
- 4. Form the trend channel
- - Upper channel band: Maximum value among the four moving averages
- - Lower channel band: Minimum value among the four moving averages
- - Channel color changes dynamically with trend direction
- ========================================
- [How to Use]
- ========================================
- [Trend Determination]
- - Blue channel = Uptrend, focus primarily on long trades
- - Red channel = Downtrend, focus primarily on short trades
- - Wider channel = Stronger momentum in the current trend
- - Narrower channel = Weaker momentum, potential trend reversal
- [Entry Signals]
- - Channel turns from Red to Blue = Bullish reversal, consider buying
- - Channel turns from Blue to Red = Bearish reversal, consider selling
- - Price pulls back to the channel edge = Trend-continuation entry opportunity
- [Stop-Loss Placement]
- - Long positions: Set stop-loss below the lower channel band
- - Short positions: Set stop-loss above the upper channel band
- - Exit promptly when the channel changes color
- [Exit Strategy]
- - Close positions when the channel color changes
- - Beware of risks when price deviates significantly from the channel
- - Take partial profits in stages upon reaching target levels
- ========================================
- [Trading Strategy Examples]
- ========================================
- [Strategy 1: Trend Following Strategy]
- 1. Wait for the channel to change from Red to Blue (bullish turn)
- 2. Price pulls back near the upper band of the blue channel
- 3. Buy upon price finding support
- 4. Place stop-loss below the lower channel band
- 5. Close position when the channel turns Red
- [Strategy 2: Channel Breakout Strategy]
- 1. Observe price action within the channel
- 2. Price breakout above the upper channel band = Strong bullish signal
- 3. Price breakdown below the lower channel band = Strong bearish signal
- 4. Enter in the breakout direction, with stop-loss placed inside the channel
- 5. Target profit equal to 1-2 times the channel width
- [Strategy 3: Multi-Timeframe Strategy]
- 1. H4 chart: Confirm overall trend direction (channel color)
- 2. H1 chart: Wait for a pullback to the channel edge
- 3. M15 chart: Find a precise entry trigger
- 4. Strictly set stop-loss according to the channel
- 5. Target a risk-reward ratio of at least 1:2
Suitable Scenarios
This product is suitable for traders seeking MT4 indicator resources for strategy backtesting, chart analysis, account management, or automated trading assistance. It is recommended to test all parameters and compatibility in a demo environment before trading with live funds.