Product details
Trend Compass_Signal Edition Product Overview
Trend Compass_Signal Edition is a trend-determination indicator designed to evaluate the trend direction of the current candlestick and issue buy or sell signals when a trend reversal occurs.
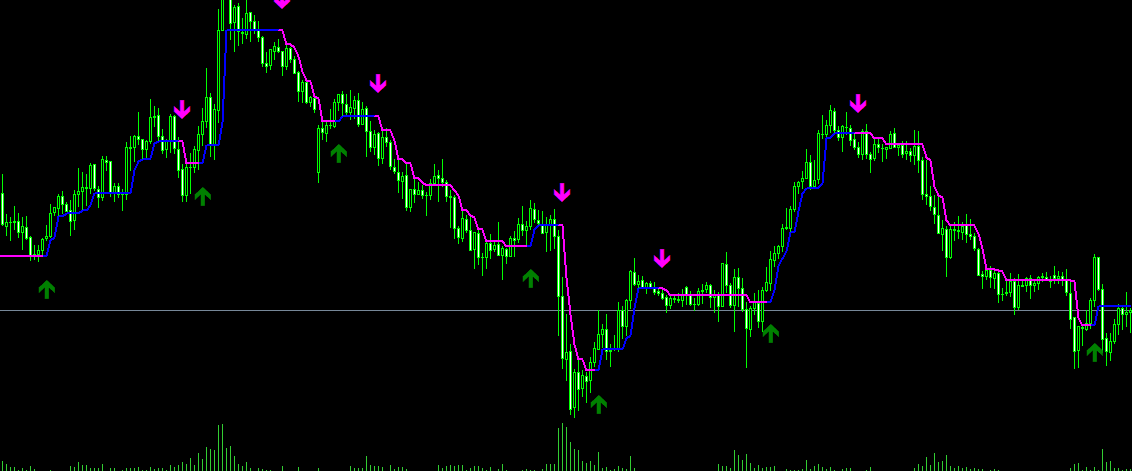
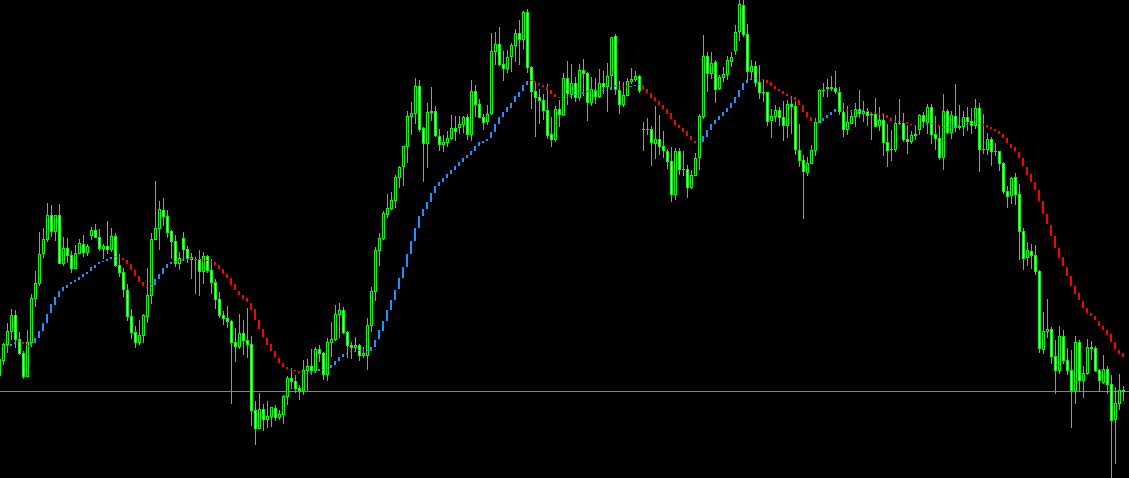
The indicator displays colored histogram bars directly in the main chart window for clear and intuitive analysis.
It also includes built-in buy/sell signal buffer data, which can be automatically read and used by EA programs.
- 2. Signal Description
- ----------------------------------------------------------------
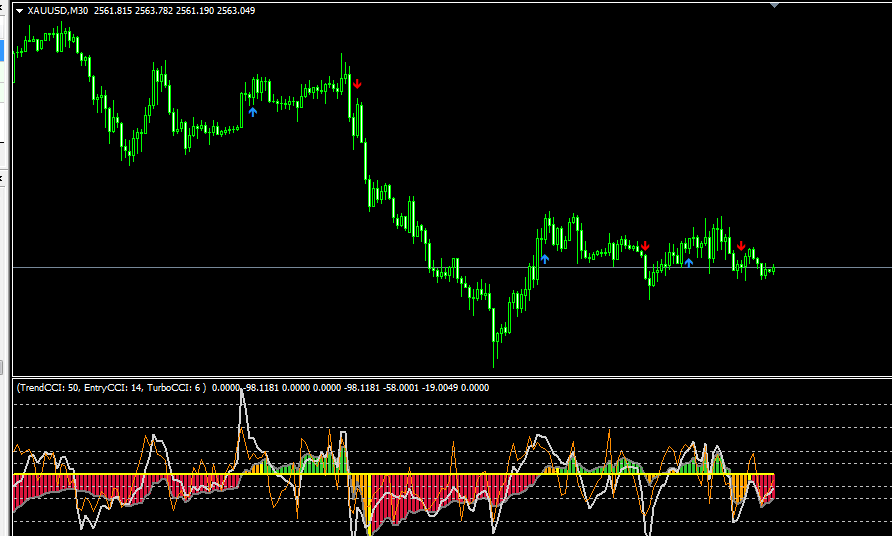
- Signals are triggered when the trend color flips, i.e., on the candlestick where the trend changes:
Buy Signal (Value = 1): Histogram changes from Red to Blue
Indicates the trend has reversed from bearish to bullish
Sell Signal (Value = 1): Histogram changes from Blue to Red
Indicates the trend has reversed from bullish to bearish
No Signal (Value = 0): Trend continues; color remains unchanged
Note: Signals are confirmed after the candlestick closes. Unclosed candlestick signals may change with price fluctuations. It is not recommended to trade based on signals before the candlestick closes.
- 3. Parameter Description
- ----------------------------------------------------------------
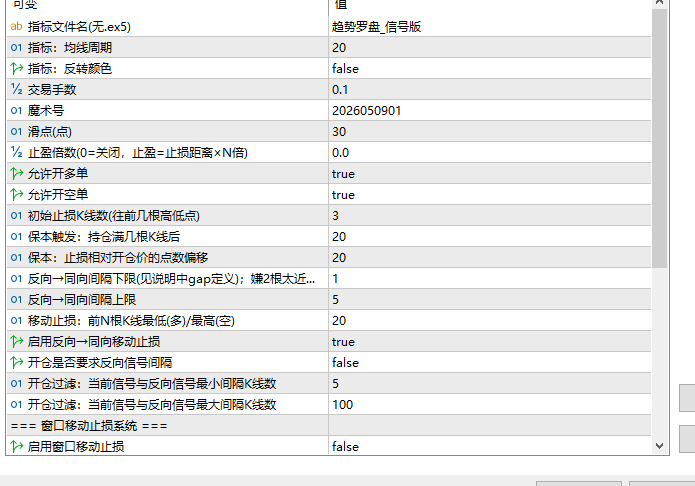
- MA Period Default: 20
- Calculation period for the EMA line.
- A higher value creates a smoother line with fewer but more stable signals;
- A lower value makes the line more sensitive, producing more signals that may include noise.
- Recommended Range: 10 to 50, test according to your symbol and time frame.
- Reverse Color Default: Disabled
- When enabled, blue and red colors swap, and the direction of buy/sell signals reverses accordingly.
- Generally, it is recommended to keep this setting turned off.
- 5. Chart Display
- ----------------------------------------------------------------
- The indicator displays in the main chart window and does not occupy a sub-window.
- Blue Histogram → Current trend is bullish
- Red Histogram → Current trend is bearish
- Histogram Height → Reflects trend momentum strength; higher bars indicate stronger momentum
- You can view specific values for each candlestick in the Data Window (Ctrl+D):
- Trend Compass → Histogram value
- Buy Signal → 1 = Buy signal generated on this candle, 0 = No signal
- Sell Signal → 1 = Sell signal generated on this candle, 0 = No signal
- 6. Usage with EA
- ----------------------------------------------------------------
- This indicator is specifically designed to work seamlessly with the "Trend Compass_Signal Edition EA".
The EA automatically executes trades at the open of the next candlestick following a signal trigger by reading the buy signal and sell signal buffer data from the indicator.
- When using the indicator standalone, you can refer to the following guidelines for manual trading:
- Buy Signal appears (Red to Blue) → Consider going long
- Sell Signal appears (Blue to Red) → Consider going short
- Signal confirmation is subject to the candlestick close
Suitable Scenarios
This product is ideal for traders looking for MT5 indicator tools to support strategy backtesting, chart analysis, account management, or automated trading. Before live deployment, it is recommended to test the parameters and compatibility in a demo account environment.