
 Practical trading resource
Fibonacci Levels Calculator | Fibonacci Retracement Calculator | Fibonacci Extension Calculator
Use our convenient Fibonacci Retracement Calculator to accurately plot Fibonacci retracement levels for any forex currency pair or other financial instrument.
Trading calculation workspace
Enter your planning values to organise a clear risk estimate before placing a trade.
Planning estimate
About Fibonacci Levels Calculator | Fibonacci Retracement Calculator | Fibonacci Extension Calculator

Use this precise Fibonacci level calculator to quickly plot hypothetical Fibonacci retracement or extension levels for any financial instrument.
What are Fibonacci Levels?
Fibonacci levels and the Fibonacci sequence are not secret ratios or hidden price patterns inherent to the market. Rather, it is a popular technical indicator and analysis method used to evaluate asset price movements in financial markets. Like other popular indicators, its effectiveness largely stems from a self-fulfilling prophecy created by a large number of traders watching the exact same levels.
Fibonacci levels are generally categorized into two types: retracement levels and extension levels. Retracement levels are applied after an asset's price hits a new high in an uptrend or a new low in a downtrend, and when traders believe the trend may be reaching a temporary pause. When the market enters a consolidation or retracement phase, prices often react near key Fibonacci retracement levels.
Key Fibonacci Retracement Levels
Commonly used Fibonacci retracement levels include: 0.236, 0.382, 0.500, 0.618, 0.764.
On the other hand, Fibonacci extension levels are applied during the trend continuation phase of an asset's price. Market prices may first retrace to a certain Fibonacci retracement level and then continue in the original trend direction to make new highs or new lows; they may also resume the prevailing trend directly after a period of consolidation without necessarily touching all retracement levels.
Key Fibonacci Extension Levels
Common Fibonacci extension levels include: 0.382, 0.618, 1.000, 1.382, 1.618.
Just as there is no "magical rule" behind the golden ratio itself, Fibonacci ratios are not mysterious price laws either. They are simply mathematically interesting proportions that were later widely adopted by traders.
Because this technical indicator is widely watched by traders globally, including many professional and institutional traders, many place buy or sell orders near these price levels, making Fibonacci levels remarkably effective in the market.
How to Use the Fibonacci Calculator?
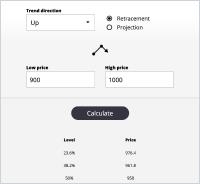
Select Trend Direction: Choose "Uptrend" or "Downtrend" in the "Trend Direction" field to simulate an upward or downward trend. For example, suppose we want to calculate the Fibonacci retracement levels for EUR/USD in an uptrend to identify a potential entry level.
Select Type: Check the "Retracement" radio button to calculate retracement levels, or select "Extension" if you want to calculate profit targets.
Enter Low Price: Input the lowest price of the EUR/USD currency pair in the "Low Price" field, which is the starting price of the uptrend, e.g., 1.16653.
Enter High Price: Input the highest price reached in the current uptrend in the "High Price" field, e.g., 1.20552.
Click the "Calculate" Button: The calculator will automatically generate the corresponding Fibonacci retracement or extension price levels.
Calculation Results Example and Meaning
The Fibonacci calculator takes two extreme swing points (the swing low and swing high, referred to as Points A and B) of an asset's price movement and divides the vertical distance by key Fibonacci ratios such as 23.6%, 38.2%, 50%, 61.8%, 78.6%, deriving the corresponding retracement price levels.
In the example above, if the lowest price (Point A) of EUR/USD in an uptrend is 1.16653 and the highest price (Point B) is 1.20552, the calculator uses these inputs to provide retracement levels at 23.6%, 38.2%, 50.0%, and so on, helping traders locate potential support zones.
Using Extension (Projection) Levels
By default, the calculator displays retracement levels. To calculate projection (extension) levels, traders need to enter a target price in the "End Price" field (required), and the calculator will display up to 6 potential extension levels, reaching up to 261.8% (2.618 Fibonacci).
Popular Fibonacci Levels Used in Live Trading
In financial trading, the three most commonly used Fibonacci retracement levels are 23.6% (0.236), 38.2% (0.382), and 50% (0.500). For extensions, the three most widely used Fibonacci extension levels are 61.8% (0.618), 100% (1.000), and 161.8% (1.618).
FAQ
What are Fibonacci levels?
Fibonacci levels are price ratios derived from the Fibonacci sequence (such as 23.6%, 38.2%, 50%, 61.8%, 78.6%, etc.), represented as horizontal price lines on a trading chart. Traders typically view these levels as potential support or resistance areas to determine where price may retrace, bounce, or face market pressure.
How are Fibonacci retracement levels used in forex trading?
In a clear uptrend or downtrend, first identify the swing low and swing high of the move, then use a Fibonacci retracement tool or the calculator on this page to calculate the key retracement levels. Traders monitor price behavior around these levels to identify potential entry points, opportunities to add to positions, or locations to adjust stop-losses, helping avoid buying high or selling low during a trend.
What inputs are required to use this Fibonacci calculator?
Select Trend Direction: Uptrend or Downtrend, to match current market movement.
Select Type: Retracement or Extension (Projection).
Enter the Low price and High price of the price move.
If calculating extensions, you can additionally enter the End price field.
Click "Calculate", and the tool will automatically output the respective Fibonacci retracement or extension price levels.
What is the difference between Fibonacci retracement and extension levels?
Retracement levels measure how far price might pull back within the current trend, estimating the depth of a correction. Extension levels forecast potential price targets when the market resumes its original trend, estimating future price objectives. Simply put, retracements are commonly used for finding trade entries or scaling points, while extensions are mostly used for planning take-profit targets or scaling out of positions.
Which Fibonacci levels are most commonly used by traders?
For retracements, the most widely applied are 38.2%, 50%, and 61.8%, followed by 23.6% and 78.6%.
For extensions, common targets include 61.8%, 100%, and 161.8%, along with more aggressive levels like 261.8%.
Trader preferences may vary slightly across different trading instruments and timeframes, but these remain the most frequently monitored set of Fibonacci levels.
Can Fibonacci levels be used as a standalone trading strategy?
It is generally not recommended to rely solely on Fibonacci levels for trading decisions. Fibonacci tools work best as complementary indicators alongside trend analysis, support and resistance levels, chart patterns, moving averages, or price action. When multiple factors align (confluence) near a specific Fibonacci level, that price point becomes significantly more reliable for setting entry, stop-loss, or take-profit targets.
Related trading tools
Explore more resources for risk, margin and trade planning.
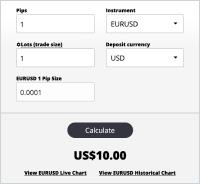
Forex Spread Calculator
The Forex Spread Calculator is an essential tool for forex traders, helping you accurately calculate spreads across different currency pairs.
Use this tool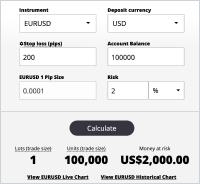
Position Size and Risk Calculator
The Forex position size and risk calculator is an indispensable tool in forex trading.
Use this tool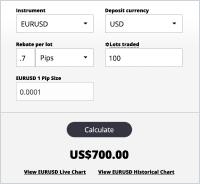
Forex Cashback Calculator
Forex cashback and rebate calculators are essential tools for forex traders, helping you maximize your trading profits.
Use this tool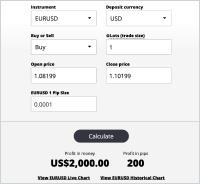
Forex Profit Calculator
The Profit and Cashback Calculator is a powerful tool for forex traders, helping you accurately calculate potential profits and cashback for your trades.
Use this tool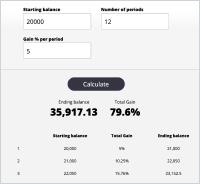
Forex Compounding Calculator
The Forex Compounding Calculator is an essential tool for forex traders, helping you project and calculate the impact of compounding on your trading account.
Use this tool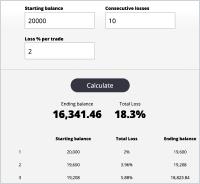
Drawdown Calculator
Use our Forex Drawdown Calculator to accurately calculate how a series of losing trades impacts your trading account balance.
Use this tool