
 Practical trading resource
Forex Pivot Point Calculator
The Forex Pivot Point Calculator is a powerful tool for forex traders to determine key support and resistance levels and help formulate trading strategies.
Trading calculation workspace
Enter your planning values to organise a clear risk estimate before placing a trade.
Planning estimate
About Forex Pivot Point Calculator

Use our convenient and accurate Forex Pivot Point Calculator to determine the next day's pivot point levels, along with three support and three resistance levels for any financial instrument. Effortlessly calculate price levels for the upcoming trading session and incorporate them into your pivot point trading strategies.
What are Pivot Points?
On a price chart, a pivot point is calculated as the sum of an instrument's high, low, and close prices from the previous trading session divided by three. During the following trading day, if the instrument's price trades below the pivot point level, it may indicate a continuing downtrend. Conversely, if the price trades above the pivot point level, it signals a potential uptrend.
The standard pivot point formula for a financial instrument, (High + Low + Close) / 3, plots the core pivot level along with three price support levels and three price resistance levels. These support and resistance levels are traded much like conventional support/resistance levels and trendlines, using a combination of breakout and bounce trading strategies.
The main advantage of the Pivot Points strategy is that it is a widely used price action trading strategy, as many traders, including large institutional professionals, watch the exact same price levels based on identical formulas. Pivot Points are popular because these key levels are predictive rather than lagging indicators. Traders use calculations based on the asset's previous trading day's price to project potential reversal points or breakout levels for the current session.
Our Pivot Point Calculator accurately computes 7 key pivot levels for any financial instrument: the central Pivot Point, 3 resistance levels, and 3 support levels. The three most commonly referenced levels are the Pivot Point (PP), Resistance 1 (R1), and Support 1 (S1).
How to Use the Pivot Point Calculator
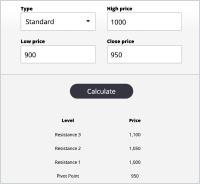
Type: In this field, traders can select from four distinct Pivot Point calculation methods. The difference among these four methods lies in the number of levels calculated and displayed:
1. Standard Method: Features 7 levels ranging between R3 and S3.
2. Woodie Method: Features 5 levels, ranging between R2 and S2.
3. Camarilla Method: Features 9 levels, ranging between R4 and S4.
4. DeMark Method: Requires the asset's open price and calculates only 2 levels between R1 and S1.
For example, let us calculate the standard pivot points for EUR/USD for the upcoming trading session. First, in our example, we will select the Standard calculation method.
High Price: In this field, enter the highest price reached by the EUR/USD pair during the previous session, such as 1.20552.
Low Price: Similar to the previous field, enter the lowest price reached by EUR/USD in the previous trading session, such as 1.19653.
Close Price: Finally, enter the closing price of EUR/USD from the previous trading session, such as 1.20154.
Now, click the "Calculate" button.
Results: The Pivot Point Calculator (Standard mode) will compute and display the 7 pivot levels for EUR/USD for the next session. The central PP level for the next day will be 1.2012, the 3 support levels will be 1.1969 (S1), 1.1922 (S2), and 1.1879 (S3), while the 3 resistance levels will be 1.2059 (R1), 1.2102 (R2), and 1.2149 (R3).
The Pivot Point trading strategy can yield great results because it is a leading price action strategy trusted by professional traders. However, some retail CFD brokers operate servers in different time zones, which may cause subtle variations in price data compared to official market hours. As a result, charts and levels may differ across different brokers' trading terminals. For maximum accuracy when using a pivot strategy, calculation data should be drawn from the asset's official market trading session, ensuring the High, Low, and Close prices align perfectly with standard market data.
Frequently Asked Questions (FAQ)
What does a Pivot Point Calculator do? How does it differ from regular support and resistance?
A Pivot Point Calculator automatically calculates key potential price levels for the current trading day based on the previous session's High, Low, and Close prices: the main Pivot Point (PP), three support levels (S1–S3), and three resistance levels (R1–R3). Unlike subjective support and resistance lines drawn manually, pivot points rely on standardized mathematical formulas. Because institutional and retail traders alike monitor the exact same levels, these points frequently act as strong price reaction zones.
Which markets are supported by the Pivot Point Calculator? Is it limited to Forex?
Pivot points are not limited to Forex; as long as High, Low, and Close prices are available, this Pivot Point Calculator can be used for any asset. Supported markets include Forex currency pairs, stock indices, individual stocks, commodities like gold and crude oil, and major cryptocurrencies like Bitcoin. All you need to do is input the price data from the asset's previous trading session.
Which Pivot Point calculation method should I choose (Standard, Woodie, Camarilla, DeMark)?
While all four methods share the core concept of calculating key levels using prices from the previous trading session, they differ primarily in weightings and the number of levels generated:
Standard Method: The most common and versatile algorithm, suitable for most traders.
Woodie Method: Places greater weight on the closing price, making it ideal for short-term trading focused on close price impacts.
Camarilla Method: Provides more levels (typically up to R4/S4), suitable for scalping and range-bound trading to precisely define support and resistance.
DeMark Method: Calculates only one support level and one resistance level, making it simpler and ideal for traders who prefer key focus prices.
If you are unsure which one to choose, start with the Standard method and gradually adjust based on your trading style.
Which price timeframe should be used to calculate Pivot Points? What is the difference between Daily and Weekly Pivot Points?
By default, traders use the High, Low, and Close of the previous daily period to calculate the current day's Pivot Points, which is most common for day trading. If you are a swing or long-term trader, you can also use data from the previous week or month to calculate Weekly Pivot Points or Monthly Pivot Points:
Daily Pivot Points: Best suited as a reference for day trading and short-term trades.
Weekly / Monthly Pivot Points: Better suited for medium- to long-term traders observing key support and resistance zones.
The key principle is to choose a timeframe that matches your actual trading strategy so that the Pivot Points remain valuable reference points.
Can I place orders solely based on the results from the Pivot Point calculator?
It is not recommended to rely solely on Pivot Points for making buy/sell decisions. A safer approach is to use Pivot Points as key price references and combine them with trend direction, candlestick patterns, volume, and other technical indicators (such as Moving Averages, RSI, MACD, etc.) for a comprehensive judgment.
Use Pivot Points first to identify potential support and resistance levels;
Wait for clear price action signals near these levels (breakouts, false breakouts, bounces, etc.);
Consider entering trades only after incorporating strict stop-loss and position management rules.
Will the Pivot Point calculation results differ across different brokers?
Yes, pivot point levels provided by different brokers may vary slightly. This is mainly due to differences in server time zones and daily close times, which lead to minor variations in the high, low, and close prices.
Try to calculate your pivot points using data from the same source as your primary trading platform;
Don't stress over minor differences of a few pips; it is far more important to observe how price actually behaves around the pivot points.
Related trading tools
Explore more resources for risk, margin and trade planning.
Forex Spread Calculator
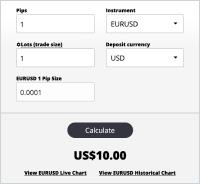
The Forex Spread Calculator is an essential tool for forex traders, helping you accurately calculate spreads across different currency pairs.
Use this tool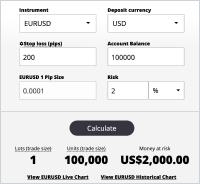
Position Size and Risk Calculator
The Forex position size and risk calculator is an indispensable tool in forex trading.
Use this tool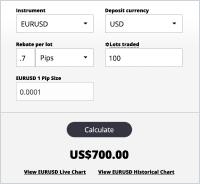
Forex Cashback Calculator
Forex cashback and rebate calculators are essential tools for forex traders, helping you maximize your trading profits.
Use this tool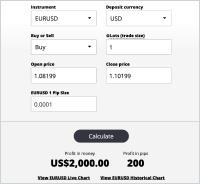
Forex Profit Calculator
The Profit and Cashback Calculator is a powerful tool for forex traders, helping you accurately calculate potential profits and cashback for your trades.
Use this tool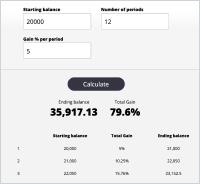
Forex Compounding Calculator
The Forex Compounding Calculator is an essential tool for forex traders, helping you project and calculate the impact of compounding on your trading account.
Use this tool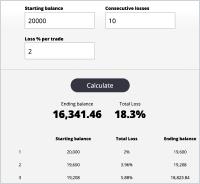
Drawdown Calculator
Use our Forex Drawdown Calculator to accurately calculate how a series of losing trades impacts your trading account balance.
Use this tool